Use metrics to monitor node performance
You can configure a GoQuorum node to collect metrics that can be viewed in a visualization tool like Grafana.
This page explains how to configure a GoQuorum node to provide metrics and enable monitoring.
Collect metrics
A GoQuorum node can collect and expose the metrics data in the following formats:
- ExpVars - The standard Go interface to instrument and expose metrics via HTTP.
- Prometheus - An alternative to ExpVars, and the preferred option because it allows users to pull or push metrics, and has a consistent metric format across languages.
- InfluxDB - Metrics can only be pushed to Influx.
Use the geth command line options --metrics, --pprof, --pprof.addr and --pprof.port where applicable, and set the scraper endpoints to the following:
- In ExpVar format,
http://127.0.0.1:6060/debug/metrics - In Prometheus format,
http://127.0.0.1:6060/debug/metrics/prometheus
Do not expose the pprof HTTP endpoint to the public internet.
This endpoint can be used to trigger resource intensive operations.
Use --metric.influxdb and associated geth command line options to push metrics data to InfluxDB.
LOGGING AND DEBUGGING OPTIONS:
  --pprof                             Enable the pprof HTTP server
  --pprof.addr value                  pprof HTTP server listening interface (default: "127.0.0.1")
  --pprof.port value                  pprof HTTP server listening port (default: 6060)

METRICS AND STATS OPTIONS:
  --metrics                           Enable metrics collection and reporting
  --metrics.expensive                 Enable expensive metrics collection and reporting
  --metrics.influxdb                  Enable metrics export/push to an external InfluxDB database
  --metrics.influxdb.endpoint value   InfluxDB API endpoint to report metrics to (default: "http://localhost:8086")
  --metrics.influxdb.database value   InfluxDB database name to push reported metrics to (default: "geth")
  --metrics.influxdb.username value   Username to authorize access to the database (default: "test")
  --metrics.influxdb.password value   Password to authorize access to the database (default: "test")
  --metrics.influxdb.tags value       Comma-separated InfluxDB tags (key/values) attached to all measurements (default: "host=localhost")
Visualize collected data
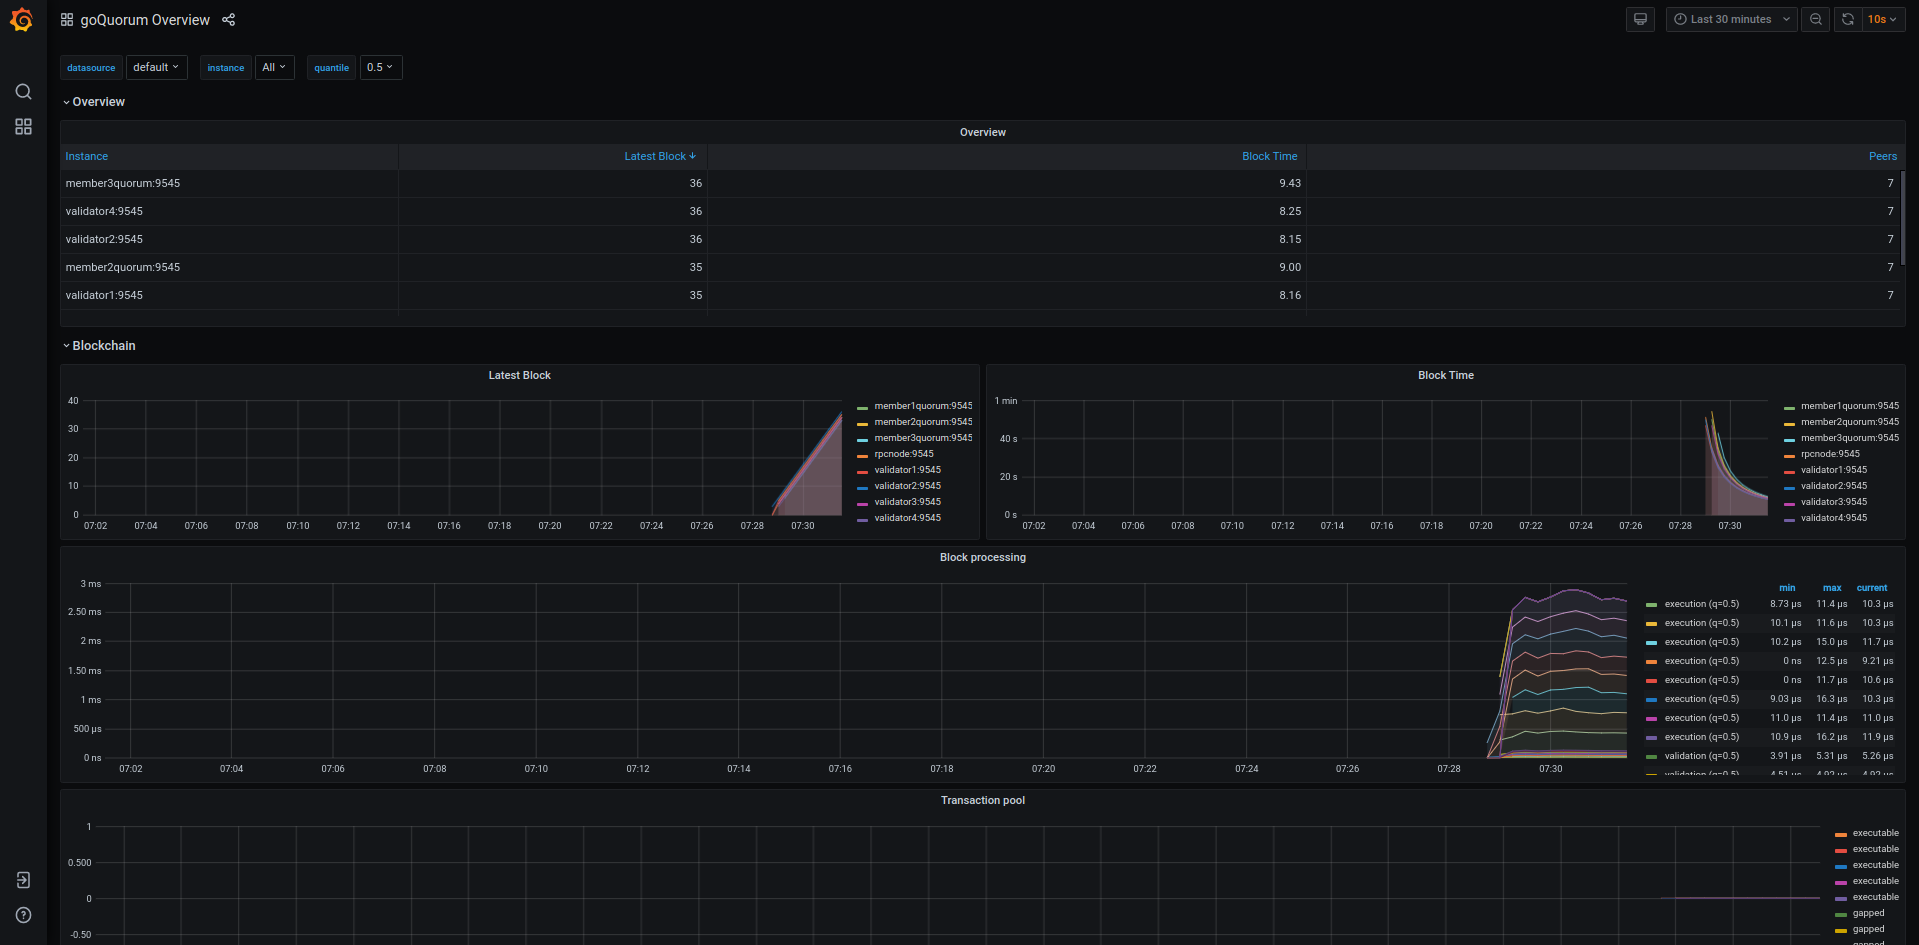
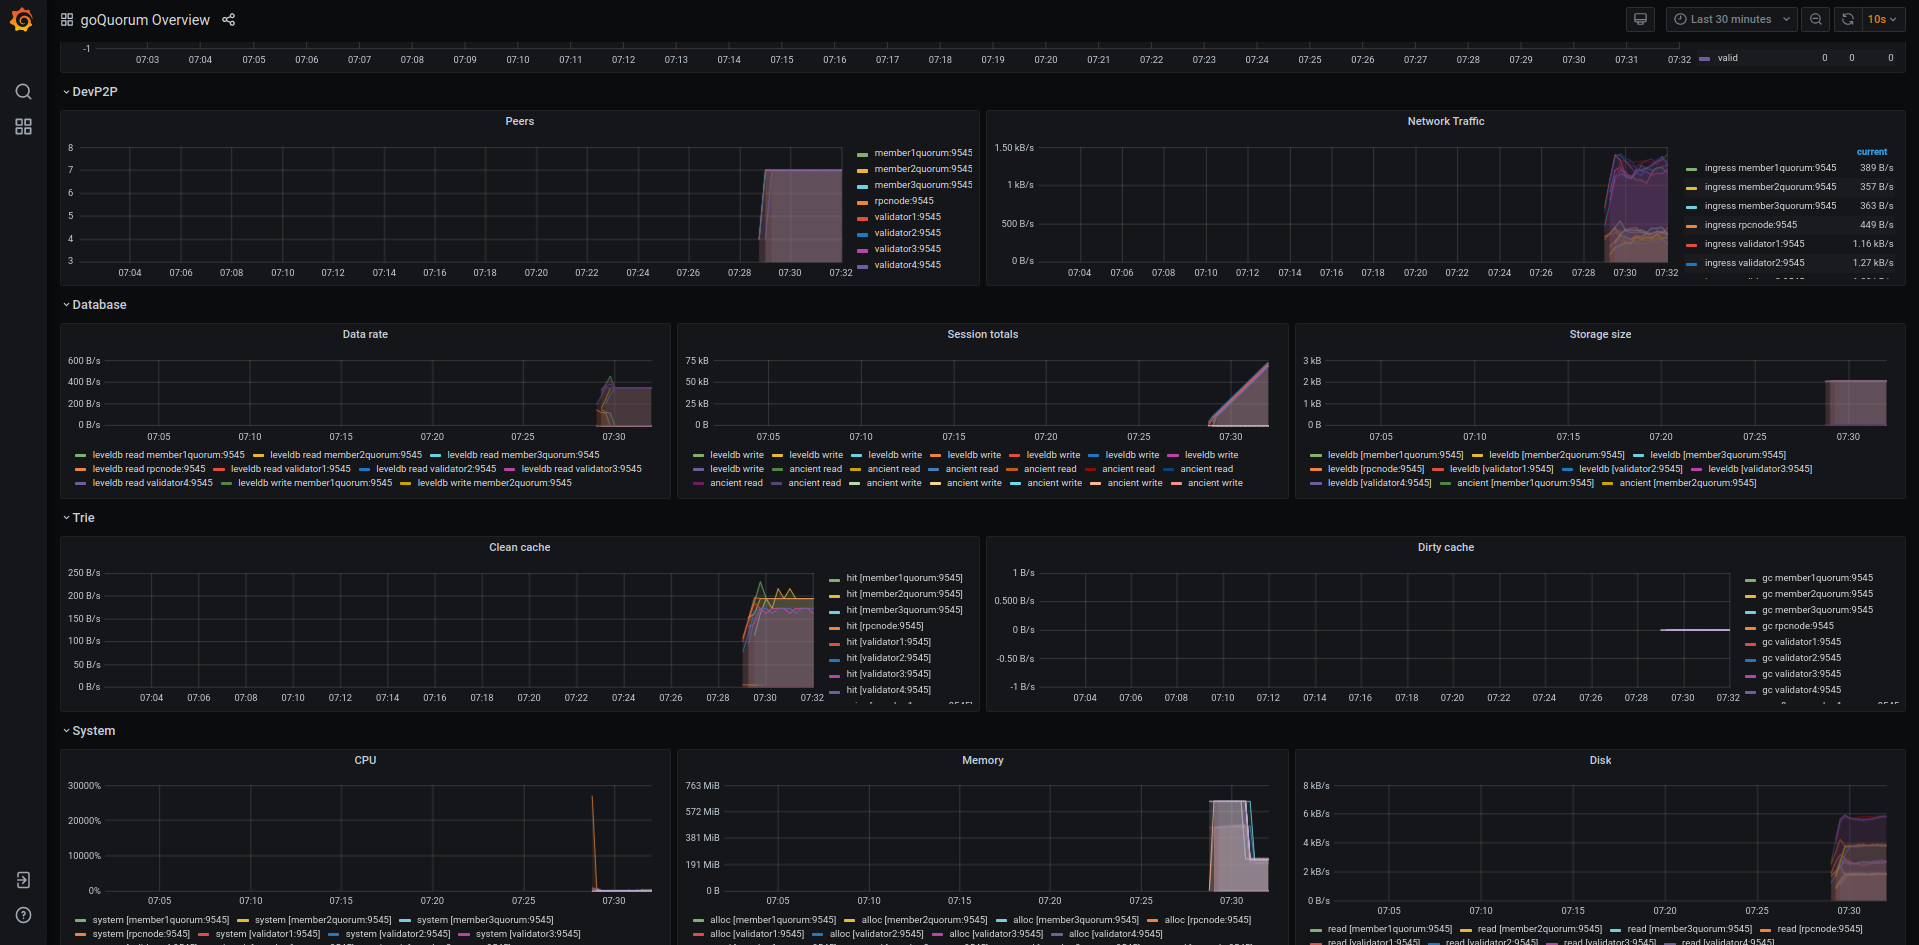
You can visualize GoQuorum metrics data with many dashboard tools. For example, you can import the GoQuorum dashboard into your Grafana instance. The GoQuorum Dashboard provides network information such as blocks and transactions per second, CPU usage, and memory usage.
If using the Quorum Developer Quickstart, the dashboard is pre-installed in the Grafana container, and the example shows how to configure nodes to use Prometheus to send metrics to Grafana.

